How withColumn Can Degrade the Performance of a Spark Job?
Using Spark’s withColumn may seem harmless, but if misused, it can slow down your job significantly! The surprising part? You might not notice it until you dig into Spark’s Logical Plans.
By the end of this newsletter edition, you will be able to identify and fix such issues in your Spark Job and write more performant code from now on.
Don't believe me ?!? Let's dive right into it.
Problem and How to Spot It
Suppose you need to add or cast hundreds of columns that need to be populated with some constant value or need casting to a specific data type.
A typical, thoughtful, and expandable approach is to get or define all such columns in a list and just run a simple for-loop:
from pyspark.sql import Row
from pyspark.sql.functions import lit, col
from pyspark.sql import SparkSession

spark = SparkSession.builder.getOrCreate()

# creating a dummy dataframe
df = spark.createDataFrame([Row(id=1, name='abc'), Row(id=2, name='xyz')])


# Creating a list of list of columns that need to be instantiated as None
dummy_col_list = ['foo1', 'foo2', 'foo3', 'foo4', 'foo5']

# Using a for-loop to add these columns in dataframe
for col_name in dummy_col_list:
  df = df.withColumn(cname, lit(None).cast('string'))
Using withColumn with for loop
Looks so clean and simple, right? Let's look at the Physical Plan of this query
df.explain("simple")== Physical Plan ==
*(1) Project [id#47L, name#48, null AS foo1#51, null AS foo2#55, null AS foo3#60, null AS foo4#66, null AS foo5#73]
+- *(1) Scan ExistingRDD[id#47L,name#48]Physical Plan generated for the execution
Everything looks fine and as expected. Cool..!! But wait, let's look at the Logical Plans also once
df.explain("extended")Logical Plan computed by Spark
== Analyzed Logical Plan ==
id: bigint, name: string, foo1: string, foo2: string, foo3: string, foo4: string, foo5: string
Project [id#47L, name#48, foo1#51, foo2#55, foo3#60, foo4#66, cast(null as string) AS foo5#73]
+- Project [id#47L, name#48, foo1#51, foo2#55, foo3#60, cast(null as string) AS foo4#66]
   +- Project [id#47L, name#48, foo1#51, foo2#55, cast(null as string) AS foo3#60]
      +- Project [id#47L, name#48, foo1#51, cast(null as string) AS foo2#55]
         +- Project [id#47L, name#48, cast(null as string) AS foo1#51]
            +- LogicalRDD [id#47L, name#48], false
Multiple Project nodes
We can see multiple project nodes (1 for each column added using withColumn)
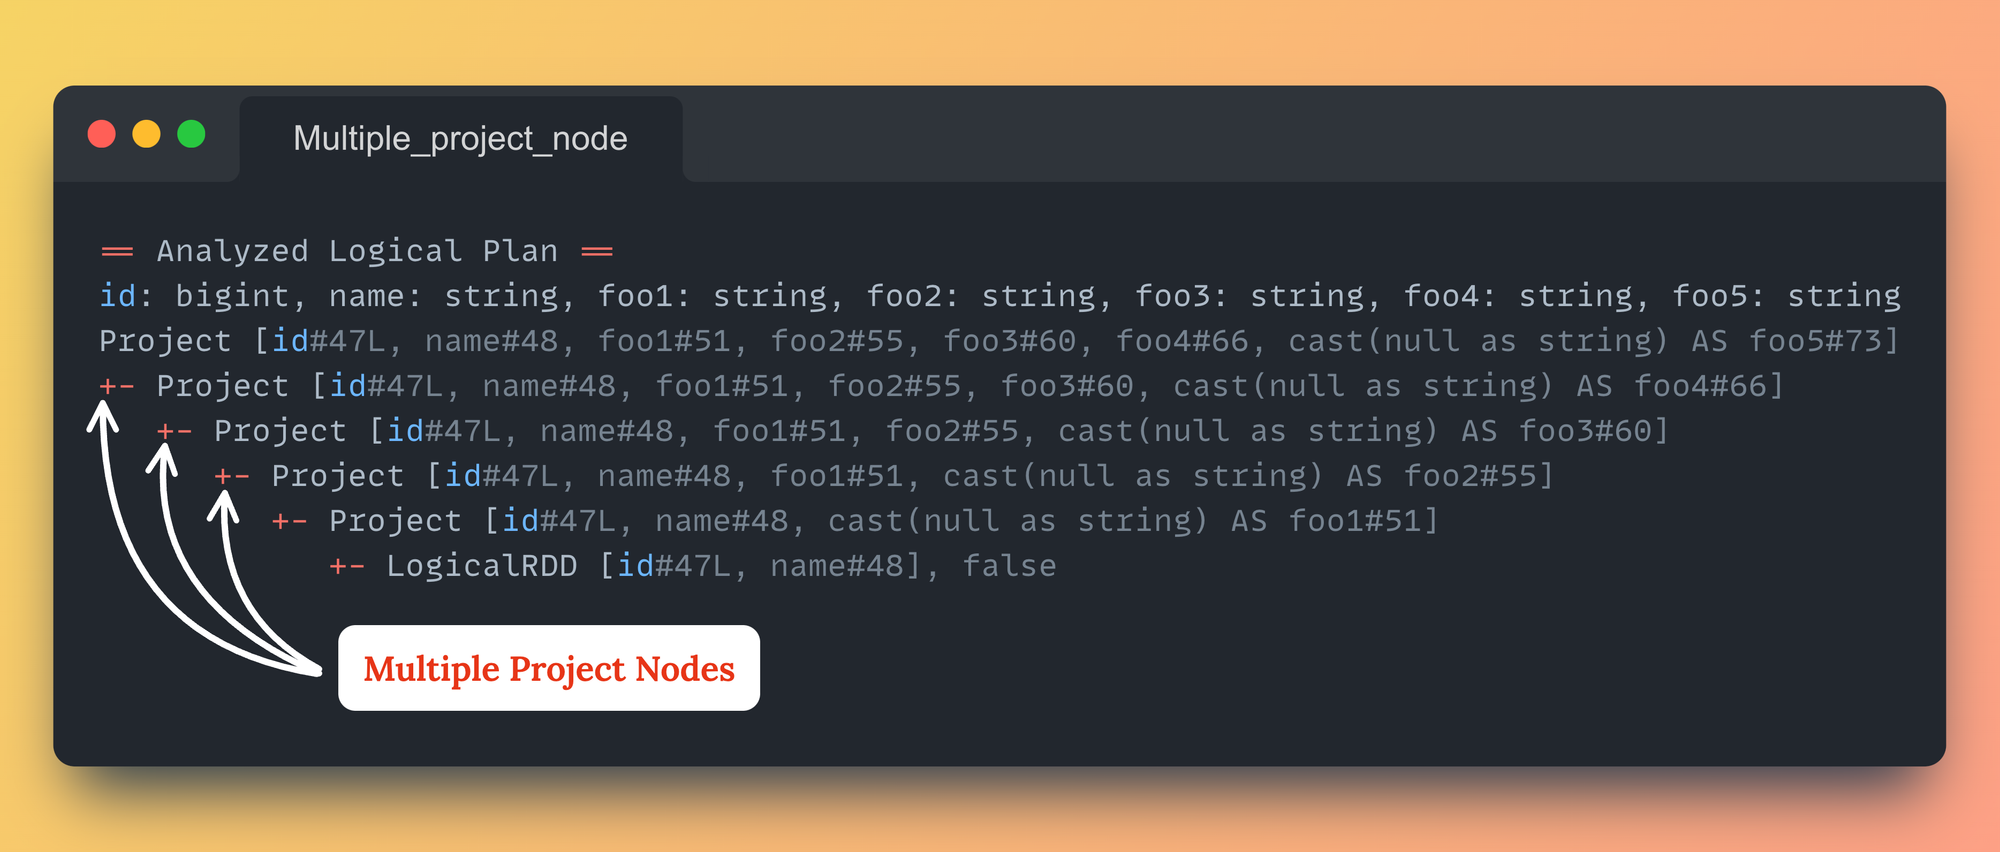
Logical Plan when multiple withColumn is usedOkay. There are multiple Project nodes, so what? It's not in the Physical Plan, and Spark will finally execute the selected Physical Plan. So, there shouldn't be any performance regression because of this during execution.

Well, the performance degradation happens before it even reaches the Physical Plan.
Cause of Performance Degradation
Each time withColumn is used to add a column in the dataframe, Spark’s Catalyst optimizer re-evaluates the whole plan repeatedly. This adds up fast and strains performance.
The surprising part? You might not notice it until you dig into Spark’s Logical Plans.
This issue is not so obvious because it doesn't show up in the SparkUI. Your job that might take only 5mins to complete, can end up taking 5x more time because of multiple withColumn.

A further deep dive into this will be in the end. Let's examine the solutions to avoid this degradation.
Solutions
Solution #1: Using .withColumns() for Spark >= 3.3
Starting from Spark 3.3, withColumns() transformation is available to use, that takes a dictionary of string and Column datatype.
# creating a dummy dataframe
df = spark.createDataFrame([Row(id=1, name='abc'), Row(id=2, name='xyz')])

# Creating a dictionary for the static columns
dummy_col_val_map = {
  'foo1': lit(None).cast('string'),
  'foo2': lit(None).cast('string'),
  'foo3': lit(None).cast('string'),
  'foo4': lit(None).cast('string'),
  'foo5': lit(None).cast('string')
}

# Adding columns using withColumns
df1 = df.withColumns(dummy_col_val_map)

# Checking both Analytical and Physical Plan
df1.explain("extended")
Using .withColumns present in Spark >= 3.3
== Analyzed Logical Plan ==
id: bigint, name: string, foo1: string, foo2: string, foo3: string, foo4: string, foo5: string
Project [id#13L, name#14, cast(null as string) AS foo1#157, cast(null as string) AS foo2#158, cast(null as string) AS foo3#159, cast(null as string) AS foo4#160, cast(null as string) AS foo5#161]
+- LogicalRDD [id#13L, name#14], false
Analyzed Logical Plan having only a single Project node
Only a single Project node present in the Logical Plan.
Solution #2: Using .select() with an alias
Another way to achieve the same is via .select with alias or .selectExpr()
# Using .select with alias
df2 = df.select("*", *[cvalue.alias(cname) for cname, cvalue in dummy_col_val_map.items()])

df2.explain("extended")
Using .select to add Columns
== Analyzed Logical Plan ==
id: bigint, name: string, foo1: string, foo2: string, foo3: string, foo4: string, foo5: string
Project [id#184L, name#185, cast(null as string) AS foo1#197, cast(null as string) AS foo2#198, cast(null as string) AS foo3#199, cast(null as string) AS foo4#200, cast(null as string) AS foo5#201]
+- LogicalRDD [id#184L, name#185], false
Analyzed Logical Plan having only a single Project node
# Using .selectExpr
df3 = df.selectExpr("*",*[f"NULL as {cname}" for cname in dummy_cols])
df3.explain("extended")
Using selectExpr to add Columns
== Analyzed Logical Plan ==
id: bigint, name: string, foo1: void, foo2: void, foo3: void, foo4: void, foo5: void
Project [id#13L, name#14, null AS foo1#145, null AS foo2#146, null AS foo3#147, null AS foo4#148, null AS foo5#149]
+- LogicalRDD [id#13L, name#14], false
Analyzed Logical Plan having only a single Project node
Only single Project Node in Logical Plans in both the cases.
FAQs
Every time I explain this, there are some follow up questions that engineers ask:
Is this the only case when .withColumn is used in for loop?
No. The same issue happens when we use multiple .withColumn outside loop also. We can look into the Logical Plan again to verify it.
# Using multiple withColumn
df4 = df.withColumn('foo1', lit(None).cast('string'))\
       .withColumn('foo2', lit(None).cast('string'))\
       .withColumn('foo3', lit(None).cast('string'))\
       .withColumn('foo4', lit(None).cast('string'))\
       .withColumn('foo5', lit(None).cast('string'))

df4.explain("extended")
Using withColumn outside for loop
== Analyzed Logical Plan ==
id: bigint, name: string, foo1: string, foo2: string, foo3: string, foo4: string, foo5: string
Project [id#13L, name#14, foo1#169, foo2#173, foo3#178, foo4#184, cast(null as string) AS foo5#191]
+- Project [id#13L, name#14, foo1#169, foo2#173, foo3#178, cast(null as string) AS foo4#184]
   +- Project [id#13L, name#14, foo1#169, foo2#173, cast(null as string) AS foo3#178]
      +- Project [id#13L, name#14, foo1#169, cast(null as string) AS foo2#173]
         +- Project [id#13L, name#14, cast(null as string) AS foo1#169]
            +- LogicalRDD [id#13L, name#14], false
Multiple Project nodes
Should we not use .withColumn at all then?
If the number of columns being added are fairly low, we can use it, it wouldn't make much of a difference.
But if you are planning to write a code, that you think can further be extended based on the upcoming requirements, I would recommend using .withColumns or other 2 options.
How many .withColumn are too many that can cause degradation?
There are no specific numbers of columns, but if you have like 100s of withColumn with some transformation logics, chances are your Spark Job can do so much better.
How can we look into SparkUI then if this is the issue?
The issue won't be so easily visible on SparkUI, the starting point is to compare the Job Uptime and the time taken by the Jobs in Spark UI Jobs tab.
If all the jobs are finishing quickly but total Uptime is significantly higher, chances are multiple withColumn are the potential cause.
If you have read it until here, you are equipped with all the tools and tricks to identify and rectify this issue.
Got any questions or suggestions? Put it in the comments.
If you are interested in what's happening internally that degrades the performance, let's dive deeper into it.
Diving a bit deeper
To reach to a Physical Plan for execution, the entire code goes through Spark Catalyst multiple stages starting from Parsing – Unresolved Logical Plan – Resolved Logical Plan – Optimized Logical Plan.
A Logical Plan is internally represented as a tree created after parsing the sql. On a very high level, all of these stages have some set of analyzer/optimizer rules that runs in batches on top of this generated tree.
Every time a .withColumn is used, all the set of rules related to it runs again.
Want to see how many rules run every time and how much time does this take?
Spark’s Catalyst optimizer uses an internal class called RuleExecutor. Its dumpTimeSpent() method can provide all such details.
When multiple .withColumn are used
from pyspark.sql import Row
from pyspark.sql.functions import lit, col
from pyspark.sql import SparkSession

spark = SparkSession.builder.getOrCreate()
# creating a dataframe
df = spark.createDataFrame([Row(id=1, name='abc'), Row(id=2, name='xyz')])

# Defining 300 columns
dummy_cols = [f"foo{i}" for i in range(1,301)]

# Get JVM reference
jvm = spark.sparkContext._jvm

# Access Scala package/class
catalyst_rule_executor = jvm.org.apache.spark.sql.catalyst.rules.RuleExecutor

# Adding 300 columns using for loop
for cname in df.columns:
  df = df.withColumn(cname, lit(None).cast(StringType()))

print(catalyst_rule_executor.dumpTimeSpent())

spark.stop()
Using RuleExecutor class to check the timing and rules run
=== Metrics of Analyzer/Optimizer Rules ===
Total number of runs: 42687
Total time: 3.158948515 seconds

....
Total Number of runs and time taken
When .withColumns is used
from pyspark.sql import Row
from pyspark.sql.functions import lit, col
from pyspark.sql import SparkSession

spark = SparkSession.builder.getOrCreate()
# creating a dataframe
df = spark.createDataFrame([Row(id=1, name='abc'), Row(id=2, name='xyz')])

# Defining 300 columns
dummy_cols = [f"foo{i}" for i in range(1,301)]

# Get JVM reference
jvm = spark.sparkContext._jvm

# Access Scala package/class
catalyst_rule_executor = jvm.org.apache.spark.sql.catalyst.rules.RuleExecutor

# Creating a dummy_col_val_map for all 300 columns
dummy_col_val_map = {cname: lit("100.326").cast('decimal(10,2)') for cname in dummy_cols}

df1 = df.withColumns(dummy_col_val_map)
print(catalyst_rule_executor.dumpTimeSpent())

spark.stop()
Using RuleExecutor class to check the timing and rules run
=== Metrics of Analyzer/Optimizer Rules === 300 columns
Total number of runs: 229
Total time: 0.111014377 seconds

....
Total Number of runs and time taken
If you look at the run and the time taken in both the cases it's whopping ~96% difference in time.
Time doesn't look much in this cases because we are just doing casting but in real project scenario, these withColumn include some complex transformation or calculation logic and those further adds more rules in the Analyzer that requires running.
Lesson Learned: Although withColumn is a lazy transformation, each use has an analysis cost.
That's it for this one! 🚀


Member discussion